neoTerra
  • Home
  • Blog
  • Woodland Gardens
  • Built-ins and Space Saving Design
  • How-To
  • Contact & Credits

December Energy Report

1/24/2016

0 Comments

 
I'm almost a month behind... but here's the December energy report.

At only 431 Heating Degree Days (HDD) December 2015 was one of the mildest on record.  The historical average is about 720 HDD so this was only 60% of the average.  We used 494 kWh for heating which comes to about $46.44 at the winter rate of 9.4 cents per kWh.

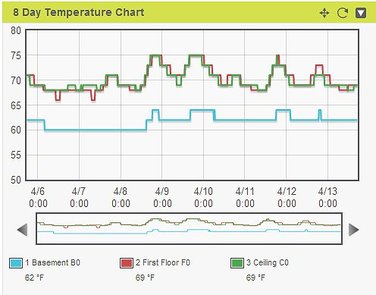
During the first half of the month only two of the seven interior units were turned on.  On December 17th I turned two basement units on in anticipation of a cold front. Those units remained on until the 24th.  The graph below shows temperatures versus energy consumed for the month.

Picture
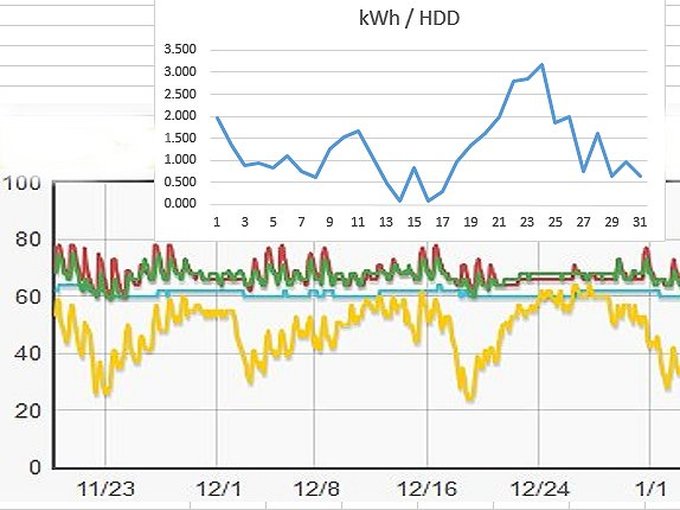
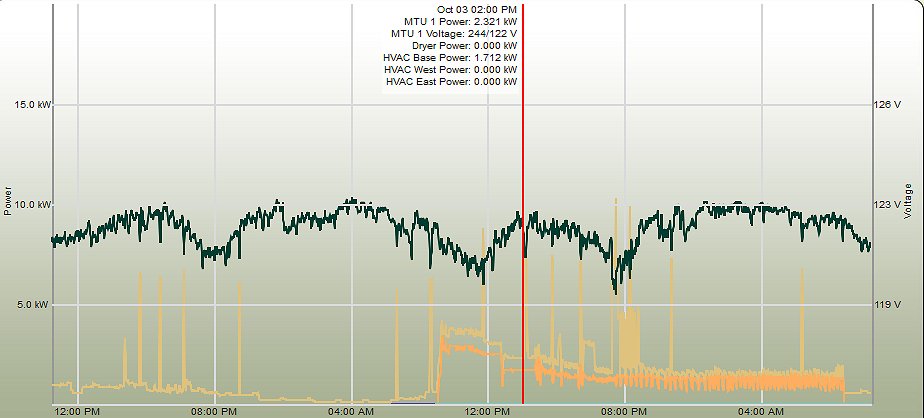
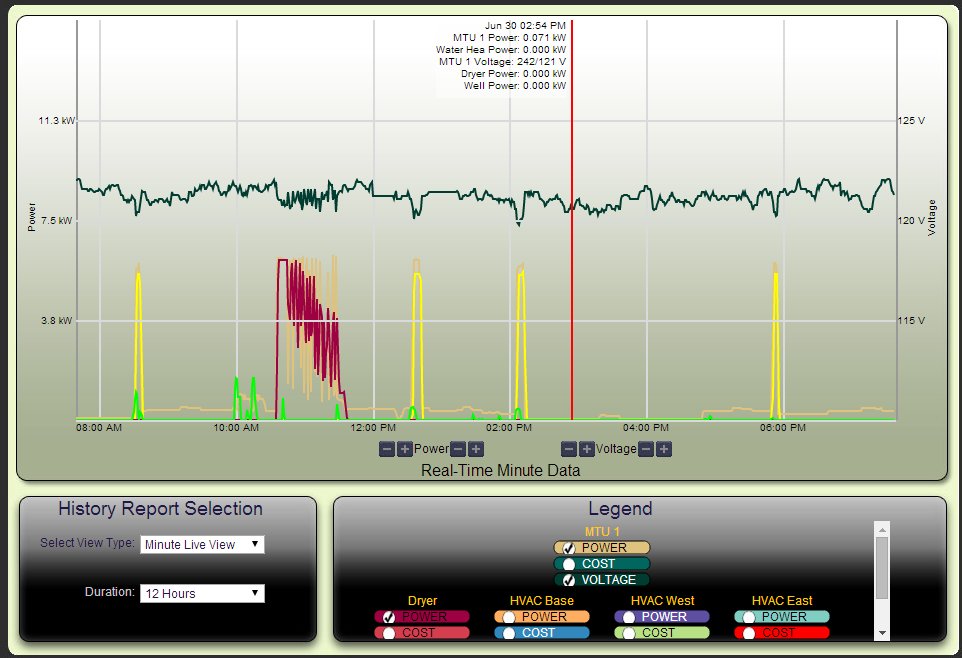
The upper chart shows energy used per HDD. Lower values indicate better performance.

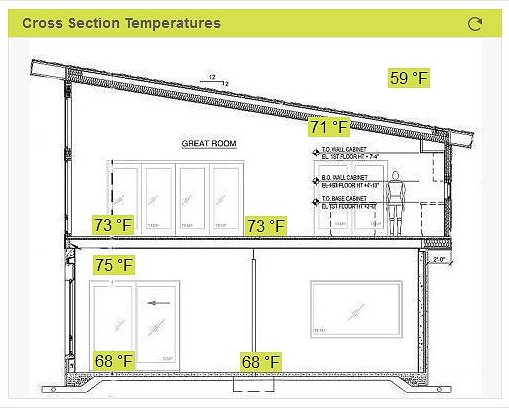
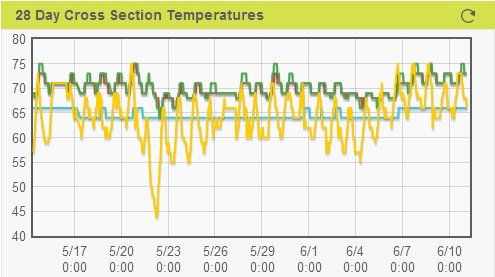
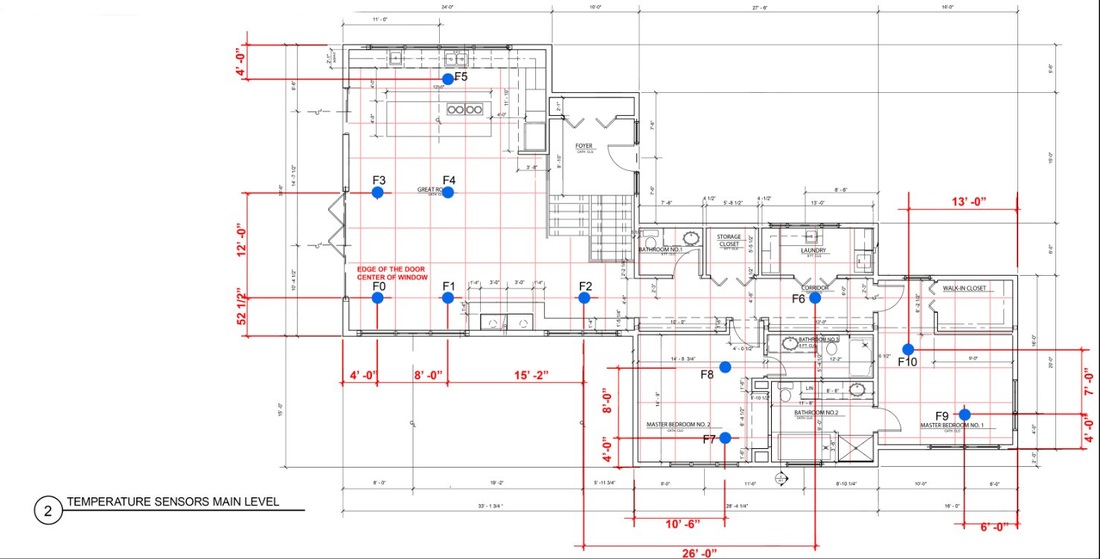
The lower chart shows temperature (Red = First floor slab, Blue = basement slab, Green=ceiling, Yellow=outdoor). Note that the ceiling sensors are located inside the insulation above the drywall so they don't indicate the actual room temperature.  The interior temperature runs 3-4 degrees warmer, so a ceiling reading of 65 corresponds to an interior temperature of about 68.

The charts clearly illustrate the effect of passive solar heating. The 3rd through the 8th were clear or mostly sunny. The temperature of the slab reached mid to upper 70's each day (except the 6th which was partly sunny).  Energy use was less than 1 kWh per HDD, which is quite good.

The 9th through the 12th were mostly cloudy or rain and there is very little heating of of the slab.  Energy use was 50% greater during this time than the previous sunny days.

As mentioned earlier, I ran two basement units between the 17th and the 23rd.  This was a mistake... there are no walls in the basement yet and we have an open stairway.  All the heat rises right up to the main level and the basement units run constantly.  On the 23rd the energy use was twice as high as the 11th even though the outside temps were a bit warmer.

I shut the basement units off on the 24th and performance improved dramatically. The lesson here is that I should only turn the basement units on when it's so cold that the 4 main level units can't keep up.


0 Comments

November Energy Report

12/16/2015

0 Comments

 
Intro
Now that heating season has arrived, I'm planning to post a monthly energy report to summarize how the design is working.

November and the first half of December have been particularly mild this year so we can't tell how the house will perform when it gets really cold.  However, with the temperature sensor array and the energy monitor it's possible to start making estimates.

Review

As a brief review, neoTerra is a passive solar design using Daikin multi-splits for HVAC. There are three independent mini-split systems with a total of seven interior units. These are:
  • HVAC WEST    2 interior units in the kitchen/great room
  • HVAC EAST    1 interior unit in each of the two bedrooms
  • HVAC BASE    3 interior units in the basement

Each of the three systems is independently monitored for energy use and data is collected each minute.


In addition there is an array of digital temperature sensors embedded in the floors and ceilings. Right now, it looks like THIS >>>>

Wow, it is 60 degrees out on December 16th.  Nice!

It's fairly sunny out and it's easy to see the effect of the sun on the slab. Areas in direct sunlight are at 73 - 78 degrees while areas that don't get sun are at 68.
Picture
Before construction, we created a computer model of the house to estimate energy efficiency over a wide range of scenarios such as increasing or decreasing the amount of glazing, different levels of insulation, and different types of HVAC systems.

Of course a computer model is based on an endless number of assumptions. If any of the assumptions are incorrect then the model will make poor predictions of actual performance.  One of the goals for this heating season is to refine the model and replace assumptions with actual data.

As an example, the computer model estimates that the heating load is approximately 15,816 BTU per Heating Degree Day. This is based on the amount of insulation and the estimated air infiltration.  The actual heat load may be quite different based on how well the insulation was installed, and how wind speed might affect the rate of air infiltration (totally unknown).

In addition, the model assumed an average efficiency of 200% for the Daikin mini-splits but the actual efficiency varies with temperature. One of the goals for this heating season is to determine the actual efficiency at different temperatures and build that data into the next generation model.
November Report
November 2015 was a very moderate month.  At 411 Heating Degree Days (HDD) it was only about 80% of the historical average for November.   We used a total of 429 kWh of electricity for heating (about $43).

During most of this period only two of the seven internal units have been turned on. 
One unit in the kitchen and one unit in the master bedroom have supplied more than adequate heat for the entire house.

Since every month is different, the best way to view the HVAC energy use is to calculate the average energy (in kWh) versus the HDD.  For November we averaged  1.04 kWh/HDD.  This was a pleasant surprise since the computer model predicted 1.58 kWh/HDD.... in other words, the house performed about 50% better than the computer model predicted.

We had 15 straight days of rain between October 26th and November 9th.  This is an absolute worst case scenario for a solar house. During this period the house used 2.03 kWh/HDD versus 2.32 predicted by the model for days without sun.

This is within about 10% of the model but it doesn't prove that the model is accurate.  For example, an experiment a few weeks ago indicates that the Daikin units are actually operating at an efficiency higher than 200%.  This implies that the heat load is greater than the model predicted.   This doesn't surprise me since we keep the house at 68 degrees and the HDD calculations are based on an average of 65 degrees. The next generation model will utilize actual temperatures from the sensor array to calculate the heating load in real-time.

We had 5 sunny days between November 13th and November 17th. During this period the house averaged .61 kWh/HDD which is much better than predicted. Put another way, we averaged about 6 cents per HDD on sunny days versus 20 cents per HDD on days without sun. 

Since the average for November was 1.04 kWh/HDD and the average for days without sun was 2.03, the sun provided almost 50% of our heat load in November in spite of 13 rain days.  I'm pretty happy with that!

Well
We strongly considered rain water harvesting early in the design phase.  Budget overruns made me defer the rainwater project.

We have been collecting energy data on the well over the past three months.  During this time we have averaged about $21 per month to operate the well.  September was more than October and November combined since we were landscaping and watering plants.

This really (pleasantly) surprised me since the well is 800 feet deep and I expected it to cost a lot more.

At this point I have decided to abandon plans for rainwater harvesting.  It would cost almost $4000 to save about $10/month on energy.  At that rate the project would take about 33 years to break even.

0 Comments

neoTerra Weather Station Online

10/18/2015

0 Comments

 
We finally have our Davis Vantage Vue weather station on-line with Weather Underground.

The station measures temperature, humidity, rainfall, wind speed and wind direction and reports the info to Weather Underground every ten minutes. 


Weather Underground PWS KGAJASPE28
Picture
0 Comments

Heating Season has Arrived - Experiment #1

10/4/2015

2 Comments

 
October is here and we are starting to get Fall weather.   It's been raining since September 20th with only a few sunny days in two weeks. 
Picture

With so little sun, the temps in the house have fallen to the mid-60s so its time to turn on the HVAC system to take the edge off the chill and dampness. 

As an aside, we only ran the AC one day this past summer. However, we ran the system in de-humidify mode for several days to take the humidity out of the basement.

By yesterday morning, the temperatures of the slabs throughout the house were uniformly at 66 degrees so I thought it would be fun (and informative) to run a little experiment.

The Experiment
I turned on two mini-splits in the basement, with the theory that heating the basement would warm the main floor slab. Since the slab has an array of embedded temperature sensors this would allow me to calculate an estimate of heat gained versus the energy consumed.

I started the test just after 9:00 using the splits under the kitchen and under BR2 and setting them to 75 degrees.  The test ran for 24 hours so I could use Heating Degree Day (HDD) calculations.

At the end of the test the temperature of the main floor slab was at 73 degrees for an increase of 7 degrees.

I was surprised that the basement slab also increased, though only by 2 degrees.

Air temperature in the basement was at 75 (as expected) and the main level was at 74.
Picture
Temperatures at the end of the test
Heat Calculations
There are two components to the heat calculations:  a) how much heat was lost through the envelope during the test period and b) how much heat was retained/stored in the thermal mass of the structure.

Based on our computer model, the heat load for the house is 15,816 BTU per HDD.  The average interior-exterior temperature difference was 13 degrees so the test simulated 13 HDD.  The estimated heat loss is 205,608 BTU.

The main floor slab consists of approximately 25 tons of concrete which will store about 10,866 BTU per degree of temperature difference. 
Since the temperature increased by 7 degrees, the slab retained about 76,000 BTU.

The basement slab only increased by 2 degrees but it is twice as thick so the basement slab retained about 42,000 BTU.


    Heat Load (consumed)            206608
    Heat stored in thermal mass    118201  

    Total heat                               323809

Energy Used
The TED energy monitor recorded a total of 35.122 kWh consumed by the mini-splits during the test.  This equals about 9220 BTU per kWh consumed which indicated an efficiency of about 270%.
Picture
Note: These are only rough estimates and don't take all of the thermal mass (drywall, steel framing, appliances, furniture, etc). into account.

In the next experiment (already started) I have turned the mini-splits off again and we will measure how long it takes for the house to fall back to 66 degrees.
2 Comments

Energy Monitor - TED (The Energy Detective)

7/1/2015

3 Comments

 
Intro
neoTerra employs a number of different techniques to conserve energy.   It is a passive solar design with high SHGC glazing to capture winter sun.  We utilized tight construction and  flash-batt insulation to reduce air infiltration and three hi-efficiency Daikin mini-split heat pumps for HVAC.

This is all good in theory, but any good science-fair project measures the actual results. As mentioned in previous posts, we installed an array of temperature sensors to obtain detailed measurements on how the passive solar design is functioning. This week, I installed an energy monitoring system so we can collect data on energy consumption.

TED (The Energy Detective
The product I selected is called TED, which is an acronym for The Energy Detective.

MTU
The basic unit is called an MTU and it measures the power for an entire breaker panel.
Picture
The MTU comes with two Current Transformers (or CTs) which are attached around the main feed lines and measure the current flowing through the lines.

The MTU is also attached to a circuit breaker which allows it to measure the house voltage.

By measuring the instantaneous voltage and current the MTU is able to calculate and report the instantaneous power for the panel each second.

Picture
Spyder
Measuring the power for the entire house is useful, but I wanted to be able to see how much power is being used by each of the three HVAC units.

TED offers an auxiliary device called the Spyder that can measure and report up to eight individual loads. It attaches to the MTU and comes with eight CTs.

I am using the Spyder to measure six loads:  3 HVAC units, the electric water heater, the well and the electric dryer.  This leaves me with two spare channels that will be used to measure power generated by a photo-voltaic system in the future.

Installation
NOTE: Installation requires opening up the breaker panel(s) and should only be done by a licensed electrician!

We have 400 Amp service consisting of two 200 Amp panels.  The main panel is on the left.  The auxiliary panel (on the right) contains a few critical circuits (like the well and refrigerator) and will be used for the future photo-voltaic system.

The MTU and Spyder are installed in bottom of the main panel.  There is a short conduit between the panels that allows sensor cables to be run to the Aux panel.
Picture
Picture
Here's a close-up of the final installation.  The MTU is on the right and the Spyder on the left. Both units should be secured to the cabinet with sheet metal screws and all the sensor cables neatly tied.
Picture
Results
Caution -- Geek Alert --

The energy monitoring system is Totally Cool!  I spent at least two hours tweaking the settings, turning stuff on and off (the toaster uses 500 watts) and playing with the graphs.  I am shocked to see that my computer uses more power than the refrigerator.

The weather here has been very moderate and the HVAC units have been turned off for the past two months. But the well, water heater and dryer make interesting graphs to illustrate how the system functions. 

The following graph shows the first 12 hours of operation.  The well is bright green, the water heater is yellow and the dryer is red.  I took a shower around 8:30 AM... you can see the well and water heater turn on.   The well ran at about 0.8 kW and the water heater at roughly 4.8 kW.  I'm surprised at how efficient the well is.

At 10:00 AM I decided to do a load of laundry (on cold) to see  what would happen.  Here you can see the well turn on and off as the washer goes through its cycles. The water heater does not turn on (as expected). Note that the well is consuming twice as much power to supply the washer as it did for the low-flow shower fixture.

The dryer (in red) consumes an impressive amount of power.  It looks like drying one load of laundry consumes more power than everything else in the house for an entire day.
Picture
Conclusions
I don't know if TED will save any energy but, combined with the temperature sensing system, it will allow us to develop a detailed understanding of how the various elements in the house interact and how well the passive solar design really works.
Picture
3 Comments

Temperature Sensors - Part III

4/13/2015

1 Comment

 
Intro
As mentioned in the first temperature Sensor post (way back in December of 2013) there's a lot of theoretical info on how much heat can be stored in the slab but there isn't very much practical info on how long it takes for the slab to warm up in the sun, how warm does it actually get and how fast does it cool off at night so I wanted a way to measure the temperature of the slab throughout the day.

My brother Phil is an experienced software engineer so he came up with a really cool system that allowed us to embed temperature sensors right in the slabs before they were poured.  We now have the system running and we're starting to collect data. 
Picture
The first step was to get all of the cables terminated.  Internet, phone, sensors....  yikes - that's a lot of cable!


Making progress...
Picture

The Hardware
We use one-wire digital temperature sensors from Dallas Semiconductor.  There are 5 sensors embedded in the basement slab, 11 in the main level slab and 4 in the main level ceilings above the drywall.   I have several spare channels that will be used to monitor outside air temperature as well as inside air temperature on both levels.

An Arduino processor (on the left) retrieves data from the sensors and a small embedded PC (on the right) collects the data and publishes it to web every 15 minutes.
Picture

Results
The planning, modelling and engineering are finally starting to come together.   Now we can monitor the temperatures of both slabs in real time.  Here are the temps right now as I'm writing this post.... How Cool Is That!!
Picture
Picture

The data is stored permanently for graphing and analysis.  The graph for the past eight days clearly shows the difference between cloudy days on the 6th and 7th versus sunny days on the 8th and 9th.  

It's interesting to note that the slab doesn't start to warm up until late afternoon (4:00 - 6:00 PM).  Following a sunny day, the slab will stay above 70 degrees for up to 12 hours.

It's already past the Spring Equinox so our heating season is almost over.  I'm looking forward to seeing how the house performs next Fall and Winter.


1 Comment

Temperature Sensors - Part II

2/2/2014

1 Comment

 
As I mentioned in a previous post, we are embedding temperature sensors in the concrete floors so we can measure the heating from the sun and the effects of thermal mass.   The crew installed 11 sensors in the upper slab before pouring the concrete.  We now have 7 sensors in the basement slab and 11 sensors in the main floor slab.

When the framing is complete we will install additional sensors in the ceilings and roof.
Picture

The first floor sensors go through the metal deck and will get routed through the basement ceilng.
Picture

The basement sensors go through the concrete floor and will be routed up through the basement walls.
Picture
Picture
1 Comment

Temperature Sensors - Science Project

12/20/2013

2 Comments

 
Since neoTerra is a passive solar project we are incorporating thermal mass in the form of concrete slabs in the basement and on the first floor (I'll talk about the construction of the suspended first floor slab in a future post).

There's a lot of theoretical info on how much heat can be stored in the slab but there isn't very much practical info on how long it takes for the slab to warm up in the sun, how warm does it actually get and how fast does it cool off at night so I wanted a way to measure the temperature of the slab throughout the day.

My brother Phil is an experienced software engineer so he came up with a really cool system that allows us to embed temperature sensors right in the slab.  It uses a very small computer called an Arduino and very precise temperature sensors from Dallas Semiconductor.   I'll post details on the project in the How-To section.

Picture
Picture

Picture
The sensors are encased in stainless steel sleeves so we can bury them diretly in the concrete.  We are putting seven sensors in the basement slab. 

Three will get direct sun, three will be in areas that get partial sun and one will be in an area that doesn't get any sun.

We are tying them to the remesh before we pour the slab.

2 Comments

    Archives

    April 2025
    December 2024
    November 2024
    October 2024
    September 2024
    August 2024
    July 2024
    June 2024
    May 2024
    April 2024
    March 2024
    February 2024
    January 2024
    December 2023
    October 2023
    September 2023
    August 2023
    July 2023
    June 2023
    May 2023
    April 2023
    March 2023
    February 2023
    January 2023
    December 2022
    November 2022
    October 2022
    September 2022
    August 2022
    July 2022
    June 2022
    May 2022
    April 2022
    March 2022
    February 2022
    January 2022
    May 2020
    January 2019
    December 2018
    February 2018
    January 2018
    December 2017
    September 2017
    July 2017
    June 2017
    March 2017
    November 2016
    October 2016
    September 2016
    August 2016
    July 2016
    May 2016
    April 2016
    March 2016
    February 2016
    January 2016
    December 2015
    October 2015
    September 2015
    August 2015
    July 2015
    June 2015
    April 2015
    November 2014
    October 2014
    September 2014
    August 2014
    July 2014
    June 2014
    May 2014
    April 2014
    March 2014
    February 2014
    January 2014
    December 2013
    November 2013
    October 2013
    September 2013
    August 2013
    July 2013
    June 2013
    March 2013
    February 2013
    January 2013


    Categories

    All
    2nd Amendment
    3D Printers
    AI
    ANTIFA
    AOC
    Apocoloptimist
    Armor
    Artemis
    Asteroids
    Baseline
    Boogeymen Of Doom
    Canning Cooking
    Canning-cooking
    Climate Hysteria
    Clown World
    Constitution
    Construction
    Cutting Cable
    Deck
    Depopulation
    Don't Panic
    Driveway
    Electrical
    Electric Vehicles
    Elitism
    Elon Musk
    Energy
    Euthanasia
    Fatphobia
    Fearsome Fallout
    Fertilizer
    Firewood
    Flamethrowers
    Front Porch
    Fun Stuff
    Fun With 80/20
    Fun With LEDs
    Future Food
    Gestapo
    Globalism
    Health Care
    Home Automation
    Home Automation
    Ikea
    Insect Farming
    Insulation
    Kamala
    Karma
    Kitchen
    Ministry Of Truth
    Multi Splits
    Multi-splits
    Open Borders
    Pandemic
    Passive Solar
    Photovoltaics
    Plumbing
    Psychology Of Fear
    Random Thoughts
    Rational Prepper
    Scarcity
    Science Projects
    Solar Power
    Spiraling Crime
    Stairs And Railings
    Starlink
    Star Trek
    Steel
    Sunspot Cycles
    Superior Walls
    Suspended Slab
    Sustaining Liberty
    Temperature Sensors
    The Changing World Order
    The End Of Private Property
    The Great Reset
    Ukraine
    Unrivaled
    Urban Exodus
    Victory Gardens
    Waffle House
    WEF
    Widllife
    Winning
    Woodland Gardens


    Follow Me on Pinterest

    RSS Feed